Basic Drawing Functions - Rectangles, Ellipses, Line Styles
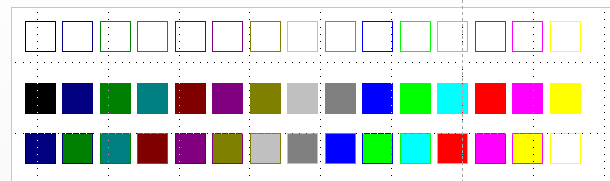
Ex.1 Draw some boxes while changing colors
Sub ColorBox()
Dim c, myBoxSize, myInterval
Dim x1, y1, x2, y2

  InitializeGraphics   ' Declaration of using graphics library

  gClear   ' Clear screen
  myBoxSize = 24
  myInterval = myBoxSize + 6
  x1 = 10
  y1 = 10
  For c = 0 To 14
     DrawRectangle x1, y1, x1 + myBoxSize, y1 + myBoxSize, QBColor(c)   ' Draw a box
     x1 = x1 + myInterval
  Next c
  x1 = 10
  y1 = 60
  For c = 0 To 14
     DrawRectangleFill x1, y1, x1 + myBoxSize, y1 + myBoxSize, QBColor(c)   ' Draw a filled box
     x1 = x1 + myInterval
  Next c
  x1 = 10
  y1 = 100
  For c = 0 To 14
   ' Draw a box with different fill color and line color
     DrawRectangleFill x1, y1, x1 + myBoxSize, y1 + myBoxSize, QBColor(c), QBColor(c + 1)
     x1 = x1 + myInterval
  Next c

 End Sub
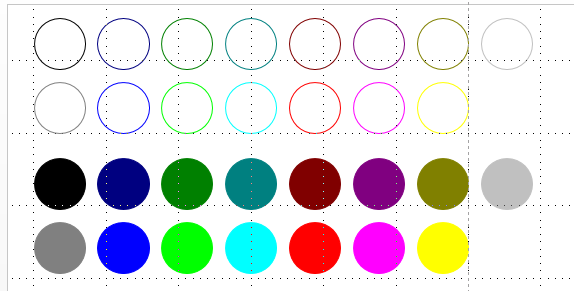
Ex.2 Draw some circles while changing colors
Sub ColorCircle()
Dim c, r, d
Dim x, y

  r = 20
  d = 50

  InitializeGraphics   ' Declaration of using graphics library

  gClear   ' Clear screen

  c = 0   ' Initialize color number
  For y = 30 To 100 Step d
    For x = 40 To 400 Step d
      DrawOval x, y, r, r, QBColor(c)   ' Draw a circle
      c = c + 1
    Next x
  Next y

  c = 0
  For y = 140 To 210 Step d
    For x = 40 To 400 Step d
      DrawOvalFill x, y, r, r, QBColor(c)   ' Draw a filled circle
      c = c + 1
    Next x
  Next y
End Sub
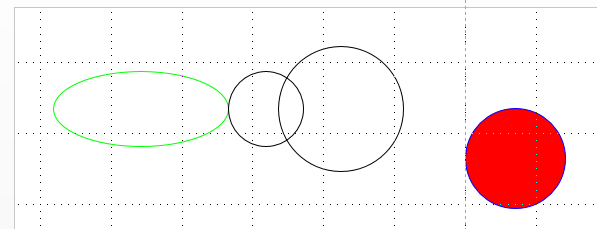
Ex.3 Draw an ellipse
Sub DrawOvalTest()

  InitializeGraphics   ' Declaration of using graphics library
  ' Draw an ellipse
  DrawOval 100, 80, 70, 30, vbGreen
  ' Draw a circle
  DrawOval 200, 80, 30, 30, vbBlack
  ' Specification of radius ratio of oval and line color by default
  DrawOval 260, 80, 50
  ' Specification of line and fill color by QBColor function
  DrawOvalFill 360, 80, 40, , QBColor(9), QBColor(12)

End Sub
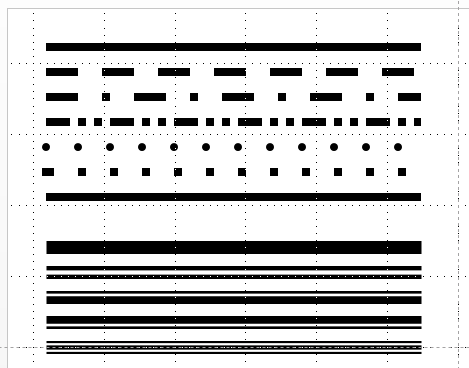
Ex.4 Change the line width and type
Sub LineStyleTest()
  Dim c, y
  Const x1 = 30
  Const x2 = 330
  Const d = 20

  InitializeGraphics   ' Declaration of using graphics library

  gClear   ' Clear screen
  gLineWidth = 6#   ' Set the line width
  c = QBColor(0)
  y = 30
  DrawLine x1, y, x2, y, c   ' Draw a line

  y = y + d
  SetDashStyle msoLineDash   ' Set line style
  DrawLine x1, y, x2, y, c

  y = y + d
  SetDashStyle msoLineDashDot
  DrawLine x1, y, x2, y, c

  y = y + d
  SetDashStyle msoLineDashDotDot
  DrawLine x1, y, x2, y, c

  y = y + d
  SetDashStyle msoLineRoundDot
  DrawLine x1, y, x2, y, c

  y = y + d
  SetDashStyle msoLineSquareDot
  DrawLine x1, y, x2, y, c

  y = y + d
  SetDashStyle msoLineSolid   '  Set the style of line - Solid line
  DrawLine x1, y, x2, y, c

  gLineWidth = 10#   ' Set the thickness of line
  y = y + d * 2
  SetLineStyle msoLineSingle
  DrawLine x1, y, x2, y, c

  y = y + d
  SetLineStyle msoLineThinThin
  DrawLine x1, y, x2, y, c

  y = y + d
  SetLineStyle msoLineThinThick
  DrawLine x1, y, x2, y, c

  y = y + d
  SetLineStyle msoLineThickThin
  DrawLine x1, y, x2, y, c

  y = y + d
  SetLineStyle msoLineThickBetweenThin
  DrawLine x1, y, x2, y, c
End Sub
Sub ColorBox() Dim c, myBoxSize, myInterval Dim x1, y1, x2, y2 InitializeGraphics ' Declaration of using graphics library gClear ' Clear screen myBoxSize = 24 myInterval = myBoxSize + 6 x1 = 10 y1 = 10 For c = 0 To 14 DrawRectangle x1, y1, x1 + myBoxSize, y1 + myBoxSize, QBColor(c) ' Draw a box x1 = x1 + myInterval Next c x1 = 10 y1 = 60 For c = 0 To 14 DrawRectangleFill x1, y1, x1 + myBoxSize, y1 + myBoxSize, QBColor(c) ' Draw a filled box x1 = x1 + myInterval Next c x1 = 10 y1 = 100 For c = 0 To 14 ' Draw a box with different fill color and line color DrawRectangleFill x1, y1, x1 + myBoxSize, y1 + myBoxSize, QBColor(c), QBColor(c + 1) x1 = x1 + myInterval Next c End Sub
Sub ColorCircle() Dim c, r, d Dim x, y r = 20 d = 50 InitializeGraphics ' Declaration of using graphics library gClear ' Clear screen c = 0 ' Initialize color number For y = 30 To 100 Step d For x = 40 To 400 Step d DrawOval x, y, r, r, QBColor(c) ' Draw a circle c = c + 1 Next x Next y c = 0 For y = 140 To 210 Step d For x = 40 To 400 Step d DrawOvalFill x, y, r, r, QBColor(c) ' Draw a filled circle c = c + 1 Next x Next y End Sub
Ex.3 Draw an ellipse
Sub DrawOvalTest()
InitializeGraphics ' Declaration of using graphics library
' Draw an ellipse
DrawOval 100, 80, 70, 30, vbGreen
' Draw a circle
DrawOval 200, 80, 30, 30, vbBlack
' Specification of radius ratio of oval and line color by default
DrawOval 260, 80, 50
' Specification of line and fill color by QBColor function
DrawOvalFill 360, 80, 40, , QBColor(9), QBColor(12)
End Sub
Ex.4 Change the line width and type
Sub LineStyleTest()
Dim c, y
Const x1 = 30
Const x2 = 330
Const d = 20
InitializeGraphics ' Declaration of using graphics library
gClear ' Clear screen
gLineWidth = 6# ' Set the line width
c = QBColor(0)
y = 30
DrawLine x1, y, x2, y, c ' Draw a line
y = y + d
SetDashStyle msoLineDash ' Set line style
DrawLine x1, y, x2, y, c
y = y + d
SetDashStyle msoLineDashDot
DrawLine x1, y, x2, y, c
y = y + d
SetDashStyle msoLineDashDotDot
DrawLine x1, y, x2, y, c
y = y + d
SetDashStyle msoLineRoundDot
DrawLine x1, y, x2, y, c
y = y + d
SetDashStyle msoLineSquareDot
DrawLine x1, y, x2, y, c
y = y + d
SetDashStyle msoLineSolid ' Set the style of line - Solid line
DrawLine x1, y, x2, y, c
gLineWidth = 10# ' Set the thickness of line
y = y + d * 2
SetLineStyle msoLineSingle
DrawLine x1, y, x2, y, c
y = y + d
SetLineStyle msoLineThinThin
DrawLine x1, y, x2, y, c
y = y + d
SetLineStyle msoLineThinThick
DrawLine x1, y, x2, y, c
y = y + d
SetLineStyle msoLineThickThin
DrawLine x1, y, x2, y, c
y = y + d
SetLineStyle msoLineThickBetweenThin
DrawLine x1, y, x2, y, c
End Sub
Sub DrawOvalTest() InitializeGraphics ' Declaration of using graphics library ' Draw an ellipse DrawOval 100, 80, 70, 30, vbGreen ' Draw a circle DrawOval 200, 80, 30, 30, vbBlack ' Specification of radius ratio of oval and line color by default DrawOval 260, 80, 50 ' Specification of line and fill color by QBColor function DrawOvalFill 360, 80, 40, , QBColor(9), QBColor(12) End Sub
Sub LineStyleTest() Dim c, y Const x1 = 30 Const x2 = 330 Const d = 20 InitializeGraphics ' Declaration of using graphics library gClear ' Clear screen gLineWidth = 6# ' Set the line width c = QBColor(0) y = 30 DrawLine x1, y, x2, y, c ' Draw a line y = y + d SetDashStyle msoLineDash ' Set line style DrawLine x1, y, x2, y, c y = y + d SetDashStyle msoLineDashDot DrawLine x1, y, x2, y, c y = y + d SetDashStyle msoLineDashDotDot DrawLine x1, y, x2, y, c y = y + d SetDashStyle msoLineRoundDot DrawLine x1, y, x2, y, c y = y + d SetDashStyle msoLineSquareDot DrawLine x1, y, x2, y, c y = y + d SetDashStyle msoLineSolid ' Set the style of line - Solid line DrawLine x1, y, x2, y, c gLineWidth = 10# ' Set the thickness of line y = y + d * 2 SetLineStyle msoLineSingle DrawLine x1, y, x2, y, c y = y + d SetLineStyle msoLineThinThin DrawLine x1, y, x2, y, c y = y + d SetLineStyle msoLineThinThick DrawLine x1, y, x2, y, c y = y + d SetLineStyle msoLineThickThin DrawLine x1, y, x2, y, c y = y + d SetLineStyle msoLineThickBetweenThin DrawLine x1, y, x2, y, c End Sub
![]()
Hiroshi Kihara owns the copyright of this page.