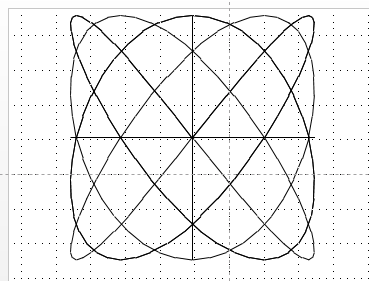
Example of using PowerPoint VBA graphics drawing library
Lissajous curve
You can change the parameter values appropriately.
Sub Draw_Lissajous()

  Dim i, d, de, alpha, beta
  Dim w1, w2, a, b
  Const Pi = 3.1415926535898

  InitializeGraphics
  SetViewPort 100, 10, 500, 410
  SetGraphicsWindow -30, -20, 30, 20
  gLineWidth = 2

  a = 30
  b = -20
  alpha = 0
  beta = 0
  d = Pi * 2 / 180
  de = 3 * Pi + d

  w1 = 4
  w2 = 5

  Lissajous a, b, d, de, w1, w2, alpha, beta, i

End Sub

Sub Lissajous(a, b, d, de, w1, w2, alpha, beta, c)

Dim T, x1, y1, x2, y2

DrawAxis a, b

x1 = a * Sin(alpha)
y1 = b * Sin(beta)

For T = d To de Step d
    x2 = a * Sin(w1 * T + alpha)
    y2 = b * Sin(w2 * T + beta)
    DrawLine x1, y1, x2, y2, QBColor(c)
    x1 = x2
    y1 = y2
Next T

End Sub

Sub DrawAxis(a, b)

  DrawLine -a, 0, a, 0
  DrawLine 0, b, 0, -b

End Sub