Example of using Excel VBA graphics drawing library
using GDI32 instructions
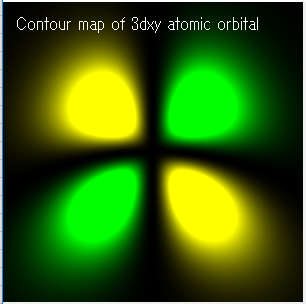
Display of an atomic orbital - Draw with PointSet
According to the electron density value of each grid point, the gradation of RGB color is changed in 256 steps to display the point.
The drawing speed is very fast compared to the case of using AddShape instructions. There is no problem with increasing the number of grid points.
Procedure
- Copy the source program of graphics drawing library by GDI32 instructions and paste to Module 2.
- Insert a user form. The size of the user form should be larger than Viewport.
- Fill in the procedure for displaying the form on the workbook
Private Sub Workbook_Open()
   UserForm1.Show
 End Sub
- Insert a button into Form
- Write a CALL statement for displaying atomic orbitals in the CommandButton1_Click procedure.
Private Sub CommandButton1_Click()
    DrawAOMap
End Sub
- Fill in Module 1 with procedures to obtain device context and display atomic orbitals.
Sub Draw_AOMap()
' Get device context handle
    monhdc = GetForegroundWindow()
    myhdc = GetDC(monhdc)
    If myhdc = 0 Then Exit Sub

' Draw contour map of atomic orbitals    by H. Kihara
' 3dxy radial distribution function
' const 0.00985 = sqrt(2)/(81*sqrt(pi))

Const DIM_X = 300
Const DIM_Y = 300
Const MAX_GRAD = 255
Const ELD = 0.000001          ' threshold

Dim CR As Integer, CG As Integer, CB As Integer
Dim r As Single, dx As Single
Dim x As Single, y As Single, px As Single, py As Single
Dim phi As Single, rho As Single
Dim i As Integer, j As Integer

    InitializeGraphics

    r = 15     ' Calculation range (in Bohr)

    dx = r * 2 / DIM_X    ' step size
    y = -r

    For i = 1 To DIM_Y
        y = y + dx
        x = -r

        For j = 1 To DIM_X
            x = x + dx
            r = Sqr(y * y + x * x)
            phi = 0.00985 * Exp(-r / 3) * x * y
            rho = phi * phi
            CG = rho / ELD
            If CG > MAX_GRAD Then CG = MAX_GRAD
            If phi < 0 Then CR = 0 Else CR = CG
'  ====  When the coordinate values are expressed in pixel units  =======
'   Conversion of coordinate value from point units to pixel units    ×72÷96
            px = i / Pt2Px: py = j / Pt2Px
            PointSet px, py, RGB(CR, CG, CB)
'  ====  When the coordinate values are expressed in point units  =======
'            PointSet i, j, RGB(CR, CG, CB)
       Next j
    Next i

End Sub
Download Excel file aomap-gdi32-eng-V104.xlsm
Download Source file trig-gdi32-eng.bas