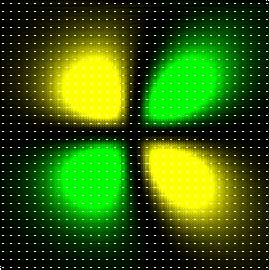
Example of using Excel VBA graphics drawing library
Display of an atomic orbital - Drawing with points
According to the electron density value of each grid point, the gradation of RGB color is changed in 256 steps to display the point.
It takes a few minutes to display the resulting diagram. Please wait for a while if the status is "No response".
※ If you increase the number of grid points, Excel may terminate abnormally depending on the environment of your computer.
It is highly recommended to use the library using GDI32 instructionsn when you increase the number of grid points.
Sub Draw_AOMap()

Const DIM_X = 100
Const DIM_Y = 100
Const MAX_GRAD = 255
Const ELD = 0.000001             ' threshold

Dim CR, CG, CB As Integer
Dim r, dx As Single
Dim x, y As Single
Dim phi, rho As Single
Dim i, j As Integer

    Call InitializeGraphics

    Call DrawRectangleFill(0, 0, DIM_X, DIM_Y, 0)

    r = 15    ' Calculation range (in Bohr)

    dx = r * 2 / DIM_X
    y = -r

    For i = 1 To DIM_Y
        Cells(13, 1).Value = i    ' Display the number of loops in progress
        y = y + dx
        x = -r

        For j = 1 To DIM_X
            x = x + dx
            r = Sqr(y*y + x*x)
            phi = 0.00985 * Exp(-r / 3) * x * y
            rho = phi * phi
            CG = rho / ELD
            If CG > MAX_GRAD Then CG = MAX_GRAD
            If phi < 0 Then CR = 0 Else CR = CG

            Call PointSet(j, i, RGB(CR, CG, CB))
        Next j
    Next i

End Sub
