Example of using Excel VBA graphics drawing library
using GDI32 instructions
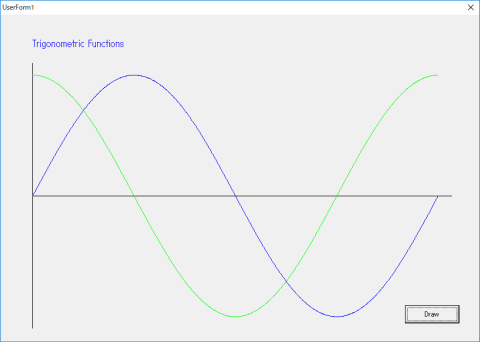
Drawing Trigonometric Curves Using PolyLine
The execution speed has been significantly improved compared to the library using the AddShape directive. Even if the number of data points is about 10,000, it will be drawn almost instantly
Procedure
- Copy the source program of graphics drawing library by GDI32 instructions and paste to Module 2.
- Insert a user form. The size of the user form should be larger than Viewport.
- Fill in the procedure for displaying the form on the workbook
Private Sub Workbook_Open()
   UserForm1.Show
 End Sub
- Insert a button into Form
- Write a CALL statement for displaying trigonometric curves in the CommandButton1_Click procedure.
Private Sub CommandButton1_Click()
    DrawTrigonometricFunction
End Sub
- Fill in Module 1 with procedures to obtain device context and display trigonometric curves.
Sub DrawTrigonometricFunction()
' Get device context handle
    monhdc = GetForegroundWindow()
    myhdc = GetDC(monhdc)
    If myhdc = 0 Then Exit Sub

    Const PI As Single = 3.14159
    Const NP As Long = 1000
    Dim x(NP), y(NP)
    Dim i, nDiv

    nDiv = NP - 1    ' Number of divisions

    InitializeGraphics
'  Specify correspondence between screen coordinates and world coordinates
   SetGraphicsWindow -0.5, 1.5, 7, -1.5
 '  Draw axes
    DrawAxis2 6.5, 1.1
   DrawText 0, 1.3, "Trigonometric Functions", vbBlue      ' Draw title

'  Draw Sine function with blue lines
    For i = 0 To nDiv
        x(i + 1) = 2 * PI * i / nDiv
        y(i + 1) = Sin(x(i + 1))
    Next

    SetLineColor (vbBlue)
    DrawPolyLine x, y, NP

 ' Draw Cosine function with greenlines
    For i = 0 To nDiv
        y(i + 1) = Cos(x(i + 1))
    Next

    SetLineColor (vbGreen)
    DrawPolyLine x, y, NP

End Sub

Sub DrawAxis2(x_max, y_max)
    DrawLine 0, 0, x_max, 0
    DrawLine 0, y_max, 0, -y_max
End Sub
Download Excel file trig-gdi32-eng-V104.xlsm
Download Source file trig-gdi32-eng.bas